Execution Logs
Execution logs provide visibility into when rules execute, what conditions were evaluated, which actions ran, and how long everything took. Use logs for debugging, auditing, and performance monitoring.
What Are Execution Logs?
Every time a business rule evaluates (whether conditions match or not), the system creates a log entry capturing:
- Rule identification - Which rule(s) executed
- Context - Entity type, entity ID, event type
- Timing - When execution started and how long it took
- Conditions - Which conditions were evaluated and their results
- Actions - Which actions executed and their outcomes
- Result - Success, failure, or error
- User context - Who triggered the rule (if applicable)
Accessing Execution Logs
Via Admin UI
- Navigate to Business Rules > Execution Logs
- View paginated list of recent executions
- Use filters to narrow results
- Click any log entry to see detailed execution trace
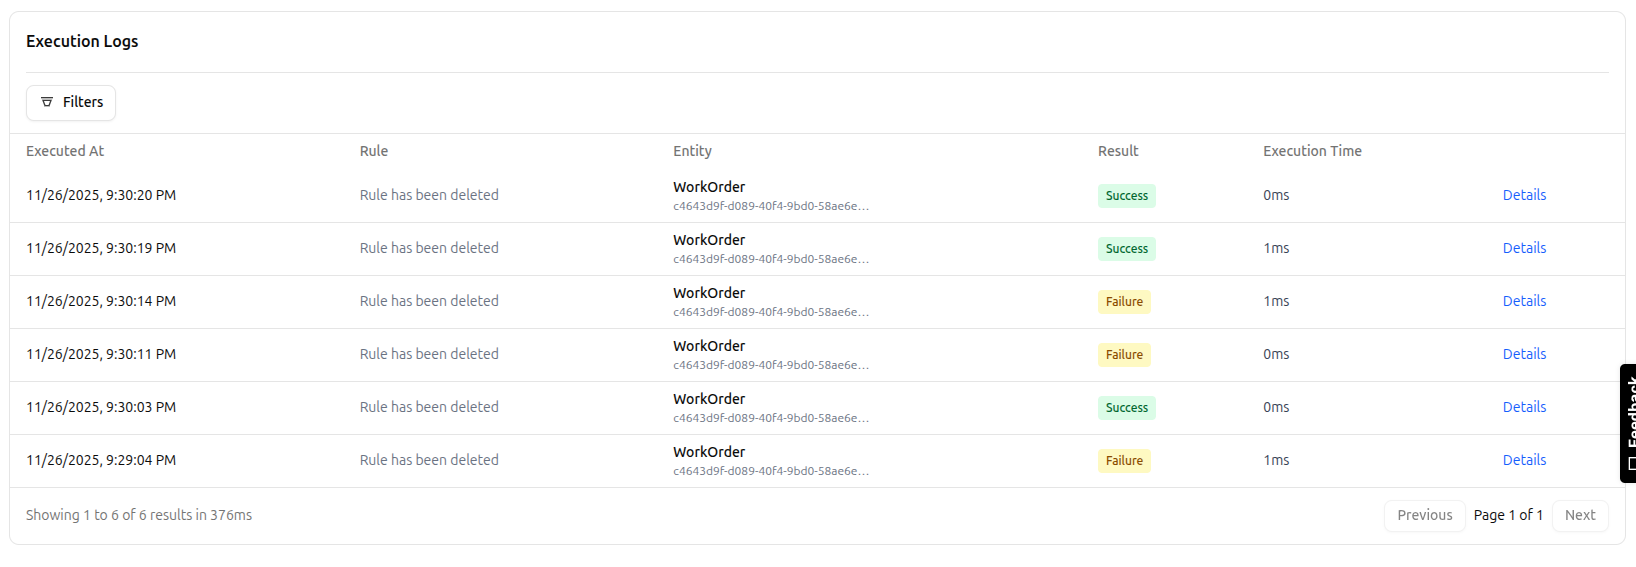 Execution logs list showing rule executions with result status, entity info, and execution time
Via API
# List recent logs
curl -X GET "$BASE_URL/api/business_rules/logs?limit=50" \
  -H "Authorization: Bearer $API_KEY"

# Get specific log
curl -X GET "$BASE_URL/api/business_rules/logs/{logId}" \
  -H "Authorization: Bearer $API_KEY"

# Filter by rule
curl -X GET "$BASE_URL/api/business_rules/logs?ruleId=MATERIAL_CHECK" \
  -H "Authorization: Bearer $API_KEY"
Log Entry Structure
Each log entry contains:
{
  id: string                    // Unique log ID
  timestamp: string             // ISO 8601 timestamp
  ruleId: string                // Rule that executed
  ruleName: string              // Human-readable rule name
  entityType: string            // Entity type (WorkOrder, Order, etc.)
  entityId: string              // Specific entity ID
  eventType: string             // Event that triggered (beforeUpdate, etc.)
  result: 'SUCCESS' | 'FAILURE' | 'ERROR'
  executionTimeMs: number       // Total execution time in milliseconds
  conditionResult: boolean      // Did conditions match?
  actionsExecuted: number       // How many actions ran
  error?: string                // Error message if result is ERROR
  context: {                    // Execution context
    userId?: string
    tenantId: string
    organizationId: string
    metadata?: Record<string, any>
  }
  trace: {                      // Detailed execution trace
    conditions: ConditionTrace[]
    actions: ActionTrace[]
  }
}
Condition Trace
Shows how each condition was evaluated:
{
  path: string                  // Field path evaluated
  operator: string              // Operator used (=, >, etc.)
  expectedValue: any            // What we were checking for
  actualValue: any              // What the field actually contained
  result: boolean               // Did this condition pass?
}
Action Trace
Shows what each action did:
{
  type: string                  // Action type (SET_FIELD, NOTIFY, etc.)
  config: Record<string, any>   // Action configuration
  result: 'SUCCESS' | 'FAILURE' | 'SKIPPED'
  executionTimeMs: number       // How long this action took
  output?: any                  // Action output (if any)
  error?: string                // Error message if failed
}
Filtering Logs
Use filters to find specific executions:
By Rule
GET /api/business_rules/logs?ruleId=MATERIAL_CHECK
Shows all executions of a specific rule.
By Entity
GET /api/business_rules/logs?entityType=WorkOrder&entityId=wo-12345
Shows all rules that executed for a specific entity.
By Result
GET /api/business_rules/logs?result=FAILURE
Shows only failed executions (conditions matched and rule triggered).
GET /api/business_rules/logs?result=ERROR
Shows only errored executions (something went wrong).
By Date Range
GET /api/business_rules/logs?from=2025-01-01&to=2025-01-31
Shows executions within a specific time period.
By User
GET /api/business_rules/logs?userId=user-abc123
Shows rules triggered by a specific user's actions.
Combined Filters
GET /api/business_rules/logs?ruleId=MATERIAL_CHECK&result=FAILURE&from=2025-01-01
All filters can be combined for precise queries.
Common Use Cases
Debugging Rules
Problem: Rule not executing when expected
Solution: Check execution logs
- Filter by entity type and event type
- Look for log entries around the expected time
- If no logs appear, rule conditions may not be matching
- If logs show SUCCESS but wrong result, check condition logic
Example:
# Check if rule executed for specific work order
GET /api/business_rules/logs?entityType=WorkOrder&entityId=wo-12345&ruleId=MATERIAL_CHECK
Review the trace.conditions array to see actual vs expected values.
Performance Monitoring
Problem: Slow rule execution affecting user experience
Solution: Identify slow rules
- Sort logs by
executionTimeMs - Look for rules taking >100ms
- Review
trace.actionsto find slow actions - Optimize slow webhooks, calculations, or database queries
Example:
# Get slowest executions
GET /api/business_rules/logs?sort=executionTimeMs:desc&limit=20
Audit Trail
Problem: Need to prove rule compliance for audit
Solution: Export execution logs
# Get all material check executions for audit period
GET /api/business_rules/logs?ruleId=MATERIAL_CHECK&from=2024-01-01&to=2024-12-31&format=csv
Logs show:
- When checks occurred
- What data was evaluated
- Who triggered the check
- What actions were taken
Error Investigation
Problem: Users reporting rule errors
Solution: Filter error logs
# Get all errors in last 24 hours
GET /api/business_rules/logs?result=ERROR&from=2025-01-22
Review error field for stack traces and error messages.
Log Retention
Default retention: 90 days
Configuration: Set BUSINESS_RULES_LOG_RETENTION_DAYS environment variable:
BUSINESS_RULES_LOG_RETENTION_DAYS=365 # Keep logs for 1 year
Manual cleanup:
# Delete logs older than 30 days
curl -X DELETE "$BASE_URL/api/business_rules/logs?olderThan=30d" \
  -H "Authorization: Bearer $API_KEY"
Log Levels
Execution logs are separate from application logs. Application logs use standard levels:
- DEBUG: Detailed rule engine internals
- INFO: Rule executions (normal operations)
- WARN: Rules blocked operations or unusual conditions
- ERROR: Rule evaluation errors
Configuration:
# Set log level in environment
LOG_LEVEL=debug  # Show all rule engine internals
LOG_LEVEL=info   # Show executions only (default)
LOG_LEVEL=warn   # Show only warnings and errors
Reading Log Traces
Example: Successful GUARD Rule
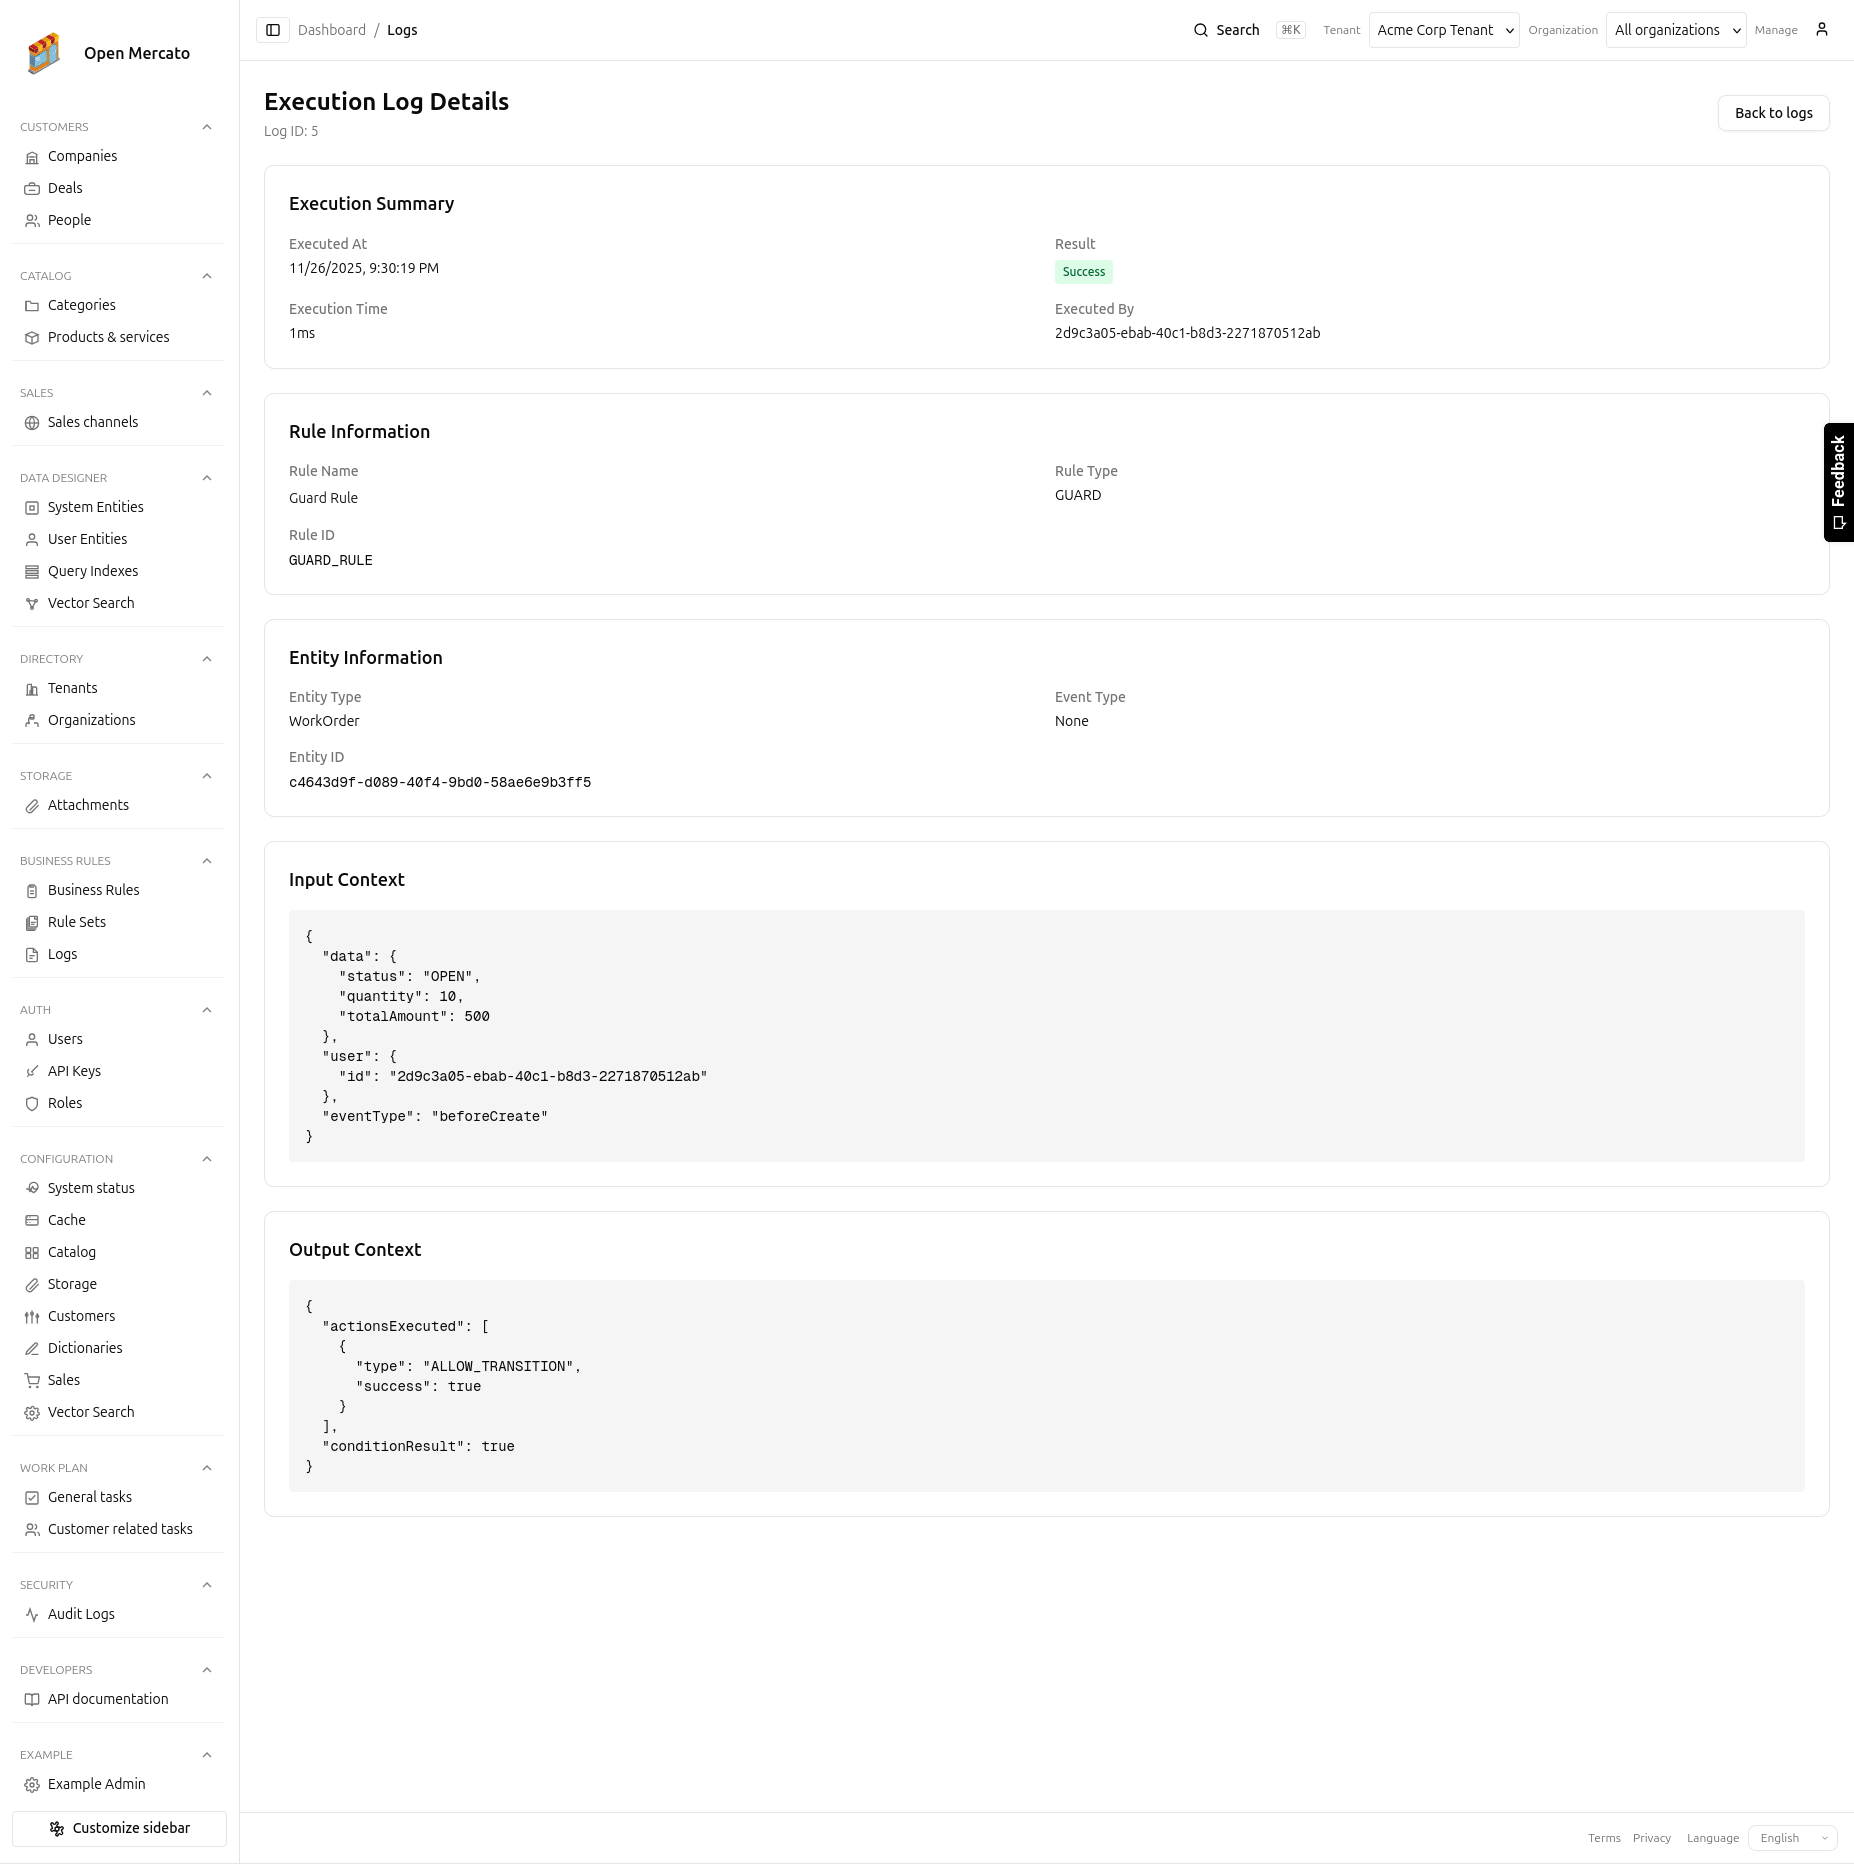 Detailed execution log showing condition evaluation trace and action results
{
  "id": "log-abc123",
  "timestamp": "2025-01-23T10:30:00Z",
  "ruleId": "MATERIAL_CHECK",
  "ruleName": "Check Material Availability",
  "entityType": "WorkOrder",
  "entityId": "wo-12345",
  "eventType": "onStatusChange",
  "result": "SUCCESS",
  "conditionResult": false,
  "executionTimeMs": 15,
  "trace": {
    "conditions": [
      {
        "path": "newStatus",
        "operator": "=",
        "expectedValue": "RELEASED",
        "actualValue": "RELEASED",
        "result": true
      },
      {
        "path": "materialsAvailable",
        "operator": "=",
        "expectedValue": false,
        "actualValue": true,
        "result": false
      }
    ],
    "actions": []
  }
}
Interpretation:
- Rule evaluated successfully (no errors)
- Condition 1 matched (status is RELEASED)
- Condition 2 did NOT match (materials are available, not unavailable)
- Overall result: false (both conditions must be true)
- No actions executed (conditions didn't match)
- Operation was allowed to proceed
Example: Failed GUARD Rule (Blocked)
{
  "id": "log-def456",
  "timestamp": "2025-01-23T11:00:00Z",
  "ruleId": "MATERIAL_CHECK",
  "ruleName": "Check Material Availability",
  "entityType": "WorkOrder",
  "entityId": "wo-67890",
  "eventType": "onStatusChange",
  "result": "FAILURE",
  "conditionResult": true,
  "executionTimeMs": 42,
  "trace": {
    "conditions": [
      {
        "path": "newStatus",
        "operator": "=",
        "expectedValue": "RELEASED",
        "actualValue": "RELEASED",
        "result": true
      },
      {
        "path": "materialsAvailable",
        "operator": "=",
        "expectedValue": false,
        "actualValue": false,
        "result": true
      }
    ],
    "actions": [
      {
        "type": "BLOCK_TRANSITION",
        "config": {},
        "result": "SUCCESS",
        "executionTimeMs": 2
      },
      {
        "type": "SHOW_ERROR",
        "config": {
          "message": "Cannot release work order. Materials not available."
        },
        "result": "SUCCESS",
        "executionTimeMs": 1
      },
      {
        "type": "NOTIFY",
        "config": {
          "recipients": ["planner@company.com"],
          "message": "WO wo-67890 blocked: materials unavailable"
        },
        "result": "SUCCESS",
        "executionTimeMs": 35
      }
    ]
  }
}
Interpretation:
- Both conditions matched (status=RELEASED, materials=false)
- Rule result: FAILURE (for GUARD rules, this means "block")
- Three actions executed:
- Blocked the transition (2ms)
- Showed error to user (1ms)
- Sent notification (35ms - most of execution time)
- Total execution: 42ms
- Operation was blocked
Example: Error Case
{
  "id": "log-xyz789",
  "timestamp": "2025-01-23T12:00:00Z",
  "ruleId": "CALCULATE_DISCOUNT",
  "ruleName": "Calculate Volume Discount",
  "entityType": "Order",
  "entityId": "order-555",
  "eventType": "beforeSave",
  "result": "ERROR",
  "conditionResult": true,
  "executionTimeMs": 8,
  "error": "TypeError: Cannot read property 'quantity' of undefined",
  "trace": {
    "conditions": [
      {
        "path": "orderType",
        "operator": "=",
        "expectedValue": "WHOLESALE",
        "actualValue": "WHOLESALE",
        "result": true
      }
    ],
    "actions": [
      {
        "type": "SET_FIELD",
        "config": {
          "field": "discount",
          "value": "{{items[0].quantity}} * 0.15"
        },
        "result": "FAILURE",
        "executionTimeMs": 8,
        "error": "TypeError: Cannot read property 'quantity' of undefined"
      }
    ]
  }
}
Interpretation:
- Conditions matched successfully
- Error occurred during action execution
- SET_FIELD action tried to access
items[0].quantity - The
itemsarray was empty or undefined - Rule execution failed, entity save may have been rolled back
Fix: Add condition to check if items exist:
AND Group:
  - orderType = "WHOLESALE"
  - items IS_NOT_EMPTY
Performance Guidelines
Target execution times:
| Rule Type | Target | Acceptable | Investigate |
|---|---|---|---|
| GUARD | < 10ms | < 50ms | >100ms |
| VALIDATION | < 20ms | < 100ms | > 200ms |
| CALCULATION | < 30ms | < 150ms | > 300ms |
| ACTION | < 100ms | < 500ms | > 1000ms |
| ASSIGNMENT | < 15ms | < 75ms | > 150ms |
Slow action types:
- CALL_WEBHOOK: 100-500ms (network dependent)
- EMIT_EVENT: 10-50ms (if subscribers are slow)
- NOTIFY: 50-200ms (email service dependent)
Optimization tips:
- Use GUARD rules sparingly (they block operations)
- Minimize webhook calls in critical paths
- Batch notifications instead of one per rule
- Use async actions for non-critical operations
- Cache expensive calculations
Monitoring Dashboards
Execution Volume
Track rule execution volume over time:
GET /api/business_rules/logs/stats?metric=volume&groupBy=hour&from=2025-01-20
Response:
{
  "metric": "volume",
  "data": [
    { "timestamp": "2025-01-20T00:00:00Z", "count": 1247 },
    { "timestamp": "2025-01-20T01:00:00Z", "count": 892 },
    // ...
  ]
}
Success Rate
Monitor rule reliability:
GET /api/business_rules/logs/stats?metric=successRate&ruleId=MATERIAL_CHECK
Response:
{
  "metric": "successRate",
  "data": {
    "total": 5000,
    "success": 4850,
    "failure": 100,
    "error": 50,
    "successRate": 0.97
  }
}
Average Execution Time
Track performance trends:
GET /api/business_rules/logs/stats?metric=avgExecutionTime&groupBy=rule
Response:
{
  "metric": "avgExecutionTime",
  "data": [
    { "ruleId": "MATERIAL_CHECK", "avgMs": 15.3 },
    { "ruleId": "CALCULATE_DISCOUNT", "avgMs": 42.7 },
    { "ruleId": "SEND_NOTIFICATION", "avgMs": 156.2 }
  ]
}
Troubleshooting
No Logs Appearing
Possible causes:
- Rule is disabled
- Entity type or event type doesn't match
- Conditions never match
- No events are being emitted
Check:
- Verify rule is enabled:
GET /api/business_rules/rules/{ruleId} - Check entity type matches exactly (case-sensitive)
- Verify event type is correct
- Add a test rule with no conditions to confirm events are firing
Logs Show Wrong Values
Possible causes:
- Field path is incorrect
- Data hasn't been updated yet (timing issue)
- Wrong event type (beforeUpdate vs afterUpdate)
Check:
- Review
trace.conditionsfor actual values - Verify field paths with dot notation
- Try different event type (beforeSave, afterSave)
High Error Rate
Possible causes:
- Rule assumptions invalid (fields don't exist)
- Webhook endpoint down
- Database schema changed
Check:
- Filter logs:
result=ERROR - Group by error message
- Identify common patterns
- Fix rule or add validation
Performance Issues
Possible causes:
- Too many rules executing
- Slow webhooks or external calls
- Complex condition evaluation
- Inefficient field access
Check:
- Sort logs by execution time
- Identify slow rules
- Review action traces for bottlenecks
- Optimize or disable non-critical rules
Best Practices
Monitor regularly: Set up dashboards to track execution volume, error rates, and performance
Alert on errors: Configure alerts for ERROR results or high failure rates
Rotate logs: Don't keep logs forever—balance compliance needs with storage costs
Analyze patterns: Look for trends in blocked operations, common failures, or slow rules
Document findings: When debugging, add notes to rule descriptions about common issues
Test thoroughly: Use execution logs to verify rules work as expected before enabling in production
Next Steps
- Rule Sets - Organize rules for easier monitoring
- API Reference - Logs API documentation
- Performance Tuning - Optimize rule execution